All Things Data Science
Fetch Day-ahead Electricity Prices, Published Via the California Independent System Operator (CAISO) API, at a User-specified Node, for a User-specified Daterange
Use PySimpleGui to Interactively Get User-input Parameters, and Move Your Script From a Jupyter Notebook to a Python Executable

This is a simple utility that uses PySimpleGui to open dialog windows to get user inputs such as date_range, node_name(s), and destination_directory. It then goes to the public API of the California Independent System Operator (CAISO) to fetch day-ahead electricity prices. From any California node, for a user-defined date range, while complying with CAISO’s public API rules.
Because there is a mandated five-second delay between API calls, and each data request is limited to 31 days worth of hourly data, the fetch utility runtime can be quite long. This is particularly true if the user specifies several price nodes and/or long date ranges. Therefore, it’s important to include a progress bar (also implemented with PySimpleGui) to keep the user apprised of the fetch status.
Finally, I want to point out that I used PySimpleGui here instead of native TKinter in order to reduce the frustration that TKinter tends to cause. I won’t say that PySimpleGui is hassle-free, but I do like that you can get simple windows and dialogs up and running very quickly. There are some limitations in terms of control and customization, but overall, a powerful tool to add to your toolbox.
You can find all of the code shown here, within the Jupyter notebook in this GitHub repository.
How and Why to Fetch Energy Prices?
CAISO, the California Independent System Operator is an entity tasked with keeping the electrical grid in California reliable and “always on”. It’s a task of enormous complexity and is often quite contentious. Many different stakeholders scream at the top of their lungs about their costs, compensation, public good, environmental impact, culture wars, wildfires, public safety … you name it.
One of the many responsibilities of CAISO is to provide all kinds information to the public, and to electricity market stakeholders. Much of this information concerns the real-time state of the electrical grid: how much power is being consumed? How much power is generated? What is the market-clearing price? The list is very long, and CAISO uses many different mechanisms to provide different types of information, but one of the major vehicles is the set of API calls available at this link.
Be it a regulated utility, power plant owner, schedule coordinator, or utility market analyst, many different stakeholders are interested in the hourly prices for electricity in the “Day-ahead” market. The day-ahead market is named in this way, because prices for the next 24 hours are set by 1:00 pm PT every day. It is the way in which most market participants decide to buy or sell electricity. Many stakeholders find themselves wanting to fetch the recent history of hourly electricity prices (day-ahead market) at a specific node. And that’s where this utility comes in.
Select a Node
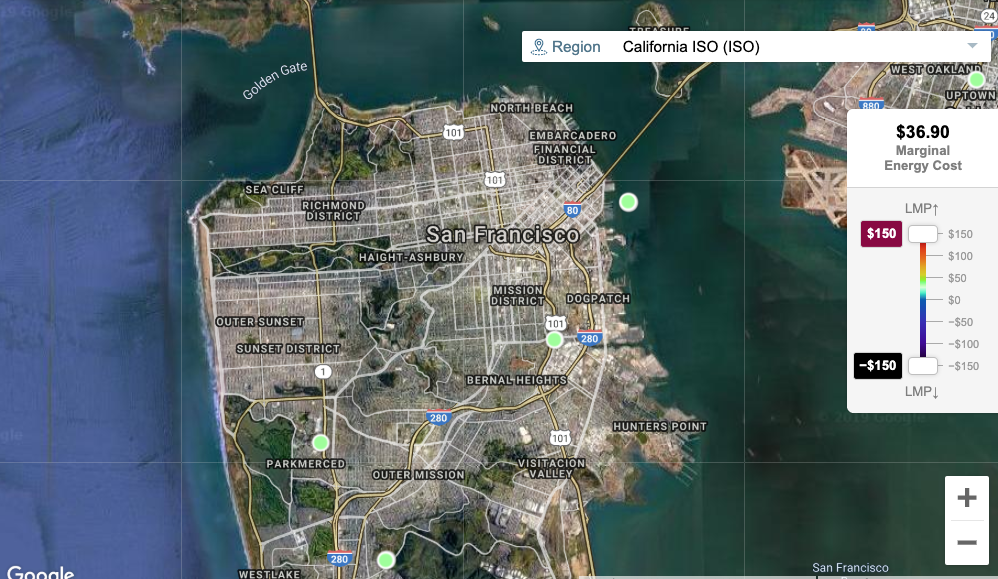
The easiest way to select an energy price node geographically (and finding its CAISO nodename) is to consult this interactive map widget (published by CAISO). The image below is a zoomed-in view of San Francisco and its four CAISO price nodes, indicated by the green circles. Mousing over these circles will display the name of that node (e.g. “BAYSHOR2_1_N001”).
Specify a Date-range
Once you’ve chosen a node (or set of nodes) whose prices you’re interested in, then next thing to decide is what date-range you want to download. CAISO has a number of constraints that it places on the public API calls, such as a strict 31-day range limit, and restriction to one call every 5 seconds. For most analysis however, one needs at least one full year of information. Electricity demand, supply, and pricing display great deal of periodicity and seasonality. One needs to know time of day, day of week, and time of year to realistically garner a picture of what the electricity market is doing at a particular node.
Therefore, this utility allows a user to arbitrarily specify a start and end date, and will intelligently create “batches” for separate requests to the CAISO OASIS web site API that will fetch a continuous hourly time-series while still conforming to the API rules.
Pick a Destination Directory & What Info to Save
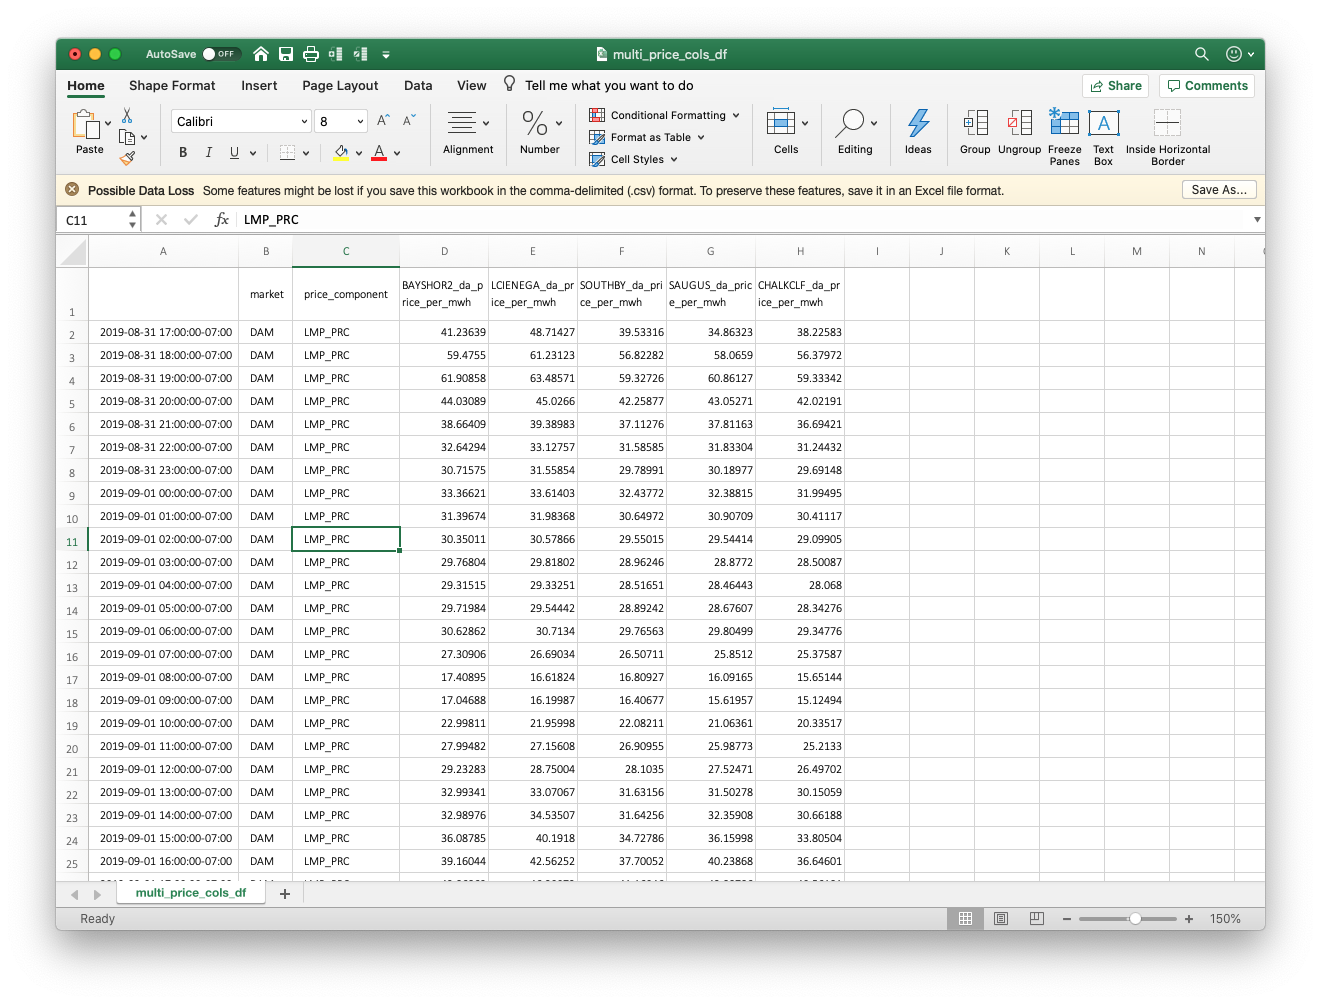
That’s it! Pick what you want to save, like interim zipped files, batch .csv files, the consolidated columnar data in .csv format, or even a binary-serialized dataframe object (.pkl file), and the application does the rest! For example, this is what an output .csv file looks like for a five-node fetch:
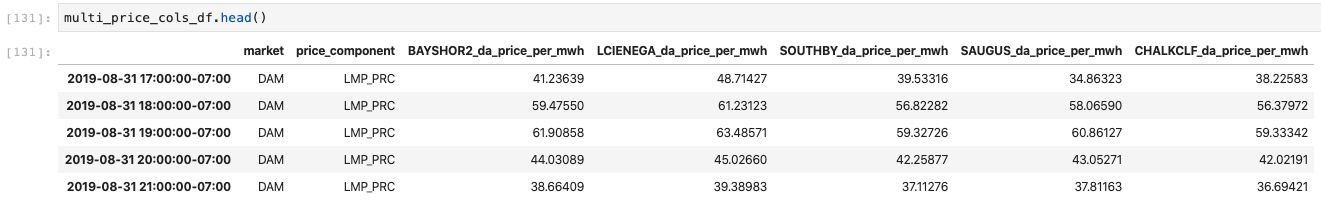
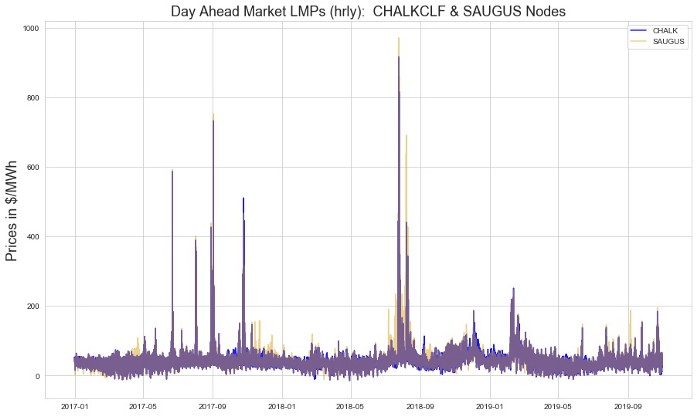
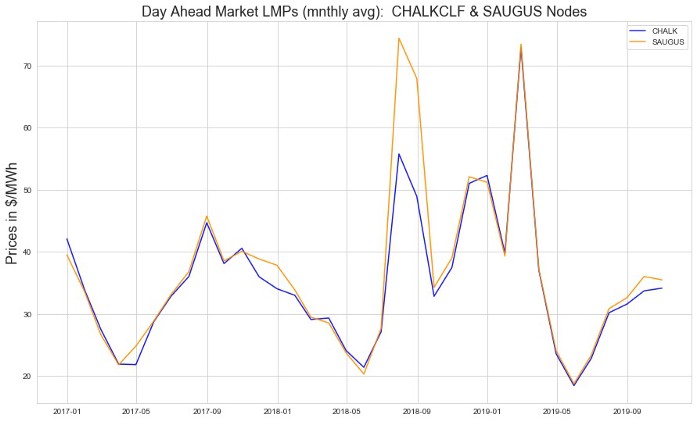
A “pickled” dataframe looks like this in Jupyter Notebooks, and allows for powerful matplotlib visualizations:
Typical Program Flow
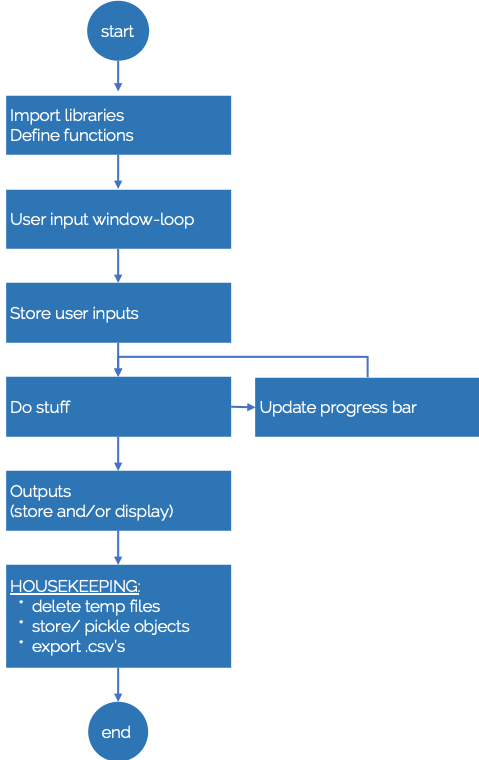
I initially wrote my fetch utility code in a Jupyter notebook, and did all my debugging and troubleshooting there. This formed the core of the “Do Stuff” box in the flowchart below. This little application wound up being very useful to me, personally. But I wondered if there was a way to make it a little more accessible to users who might not want to run things from Jupyter notebooks.
After I was certain that the functions and connective code was operating correctly, I turned my attention to the structure of what this might look like as a standalone Python script. I used a block diagram (flowchart) to keep all the steps clear in my mind as I worked on the different PySimpleGui elements that would be needed to interact with the user when the script was run.
Imports and Required Libraries
There are ten different modules imported and used here, which is why this utility is less than 400 lines of code, yet has robust functionality. Hooray for Python and the open source community!
It’s important that anyone running this script has installed Python 3.6 or above, as well as the import modules below. I won’t go into the use of Conda, HomeBrew, or Pip in this post, but there is a lot of available documentation to walk you through the installs if you don’t have any of these packages on your machine.
# CAISO Electricity Day-ahead Price Fetch Utility
# Manu Kalia
# 05-Dec-2019
# All rights reservedimport pandas as pd
import wget, os, zipfile, glob, shutil
import time, pickle, re
import PySimpleGUI as sg
The User Inputs Window
While the PySimpleGui (aliased as “sg”) may look a bit cluttered, the structure is actually very logical. There are a number of parameters like window size and font that determine the specifics of the user interface elements, most of this library is hidden behind the scenes.
Most aspects of the input_window are defined within the “input_window_layout” variable as shown in the code block below. Below the “input_window_layout” assignment, the “sg.Window()” call does the heavy lifting of defining a window, and applying the input_window_layout parameters.
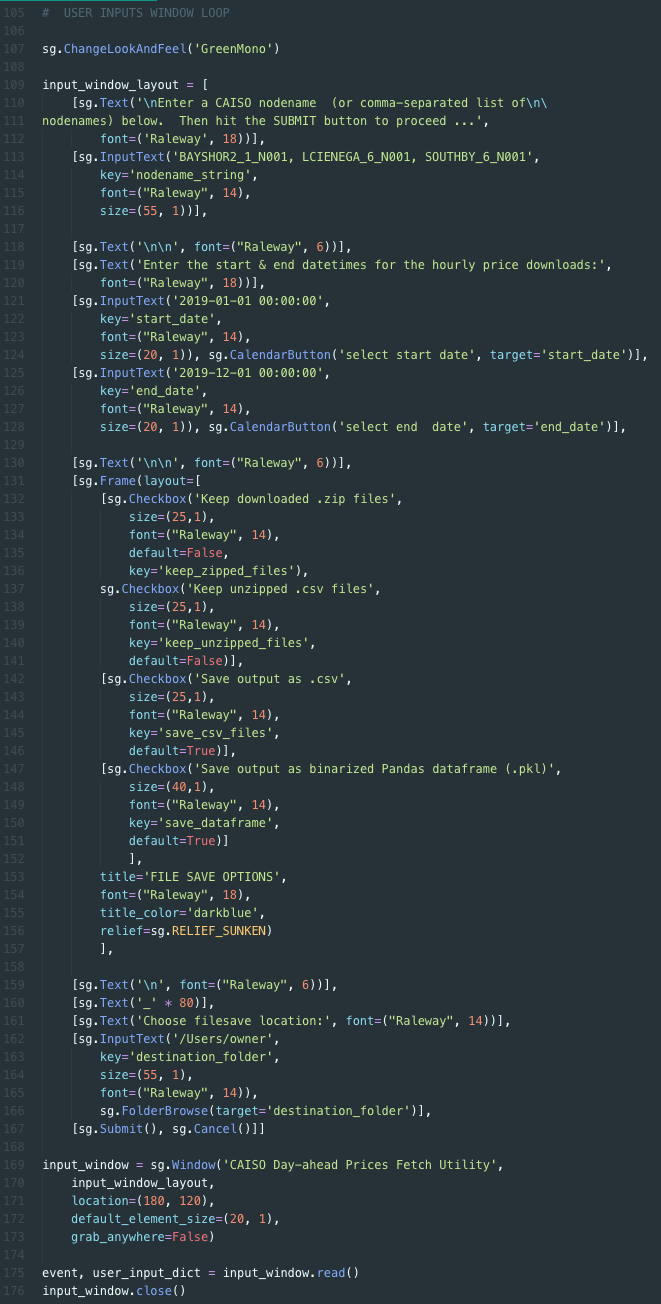
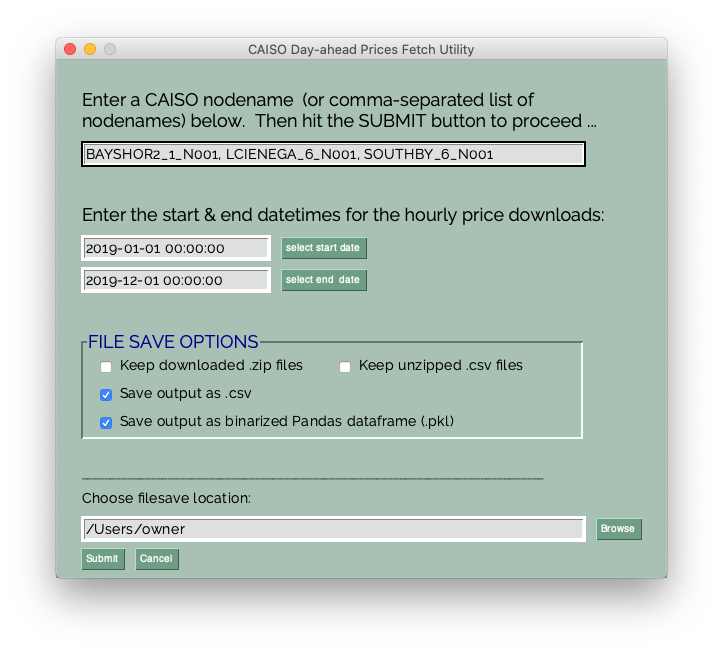
Here is what the input_window code looks like in execution:
Most importantly for our purposes, the “input_window.read()” method in the second-to-last line of the code block above is what gets us what we need: the user inputs. For example:
event, user_input_dict = input_window.read()
When the “submit” button is activated by the user, the “event” becomes TRUE, and all of the elements within the window that had “key” values assigned to them are stored in a dictionary. I named this dictionary “user_inputs_dict”, and the values stored in it are what drive many of the other critical functions of this application.
You can see in the longer code block above that there are various “InputText()” and “Checkbox()” elements that include parameter assignments for keys. For example, take a look at the first sg.InputText() method call above, in which the name(s) of the CAISO nodes are requested from the user, and stored in the dictionary user_inputs_dict[‘nodename_string’]:
[sg.InputText('BAYSHOR2_1_N001, LCIENEGA_6_N001, SOUTHBY_6_N001',
key='nodename_string',
font=("Raleway", 14),
size=(55, 1))],
There are 8 keys that correspond to user input variables that we gather in this input_window loop, and getting this input is the sole purpose for this user interface window:
- nodename_string
- start_date
- end_date
- keep_zipped_files (boolean)
- keep_unzipped_files (boolean)
- save_csv_files (boolean)
- save_dataframe (boolean)
- destination_folder
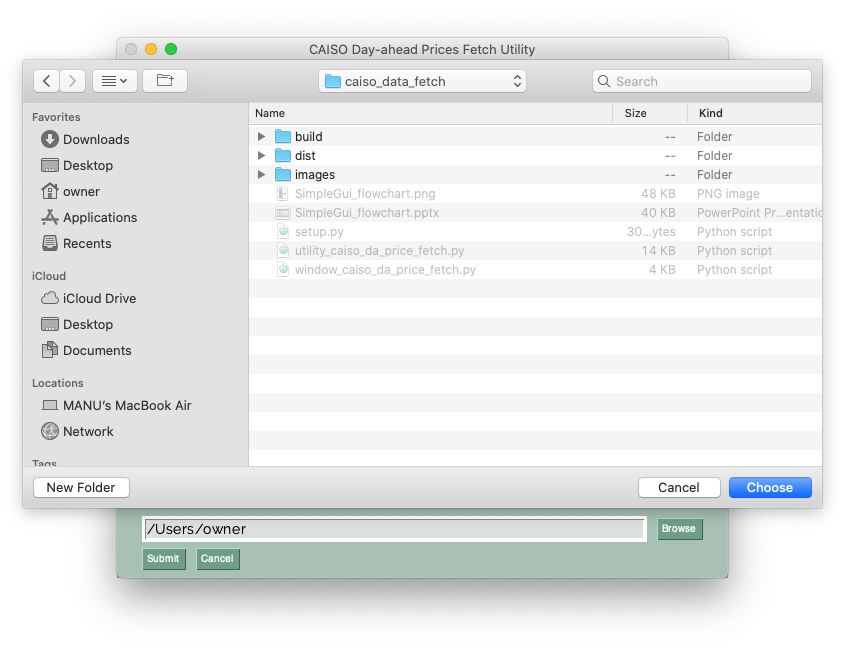
Filesave Location Button
Believe it or not, the “sg.FolderBrowse()” method (button specification) shown below (which is included in the input_window_layout code block above) is everything required to create the entire dialog box functionality! It prompts the user to select a destination directory to save files, temporary files, downloads, etc.
[sg.Text('\n', font=("Raleway", 6))],
[sg.Text('_' * 80)],
[sg.Text('Choose filesave location:', font=("Raleway", 14))],
[sg.InputText('/Users/owner',
key='destination_folder',
size=(55, 1),
font=("Raleway", 14)),
sg.FolderBrowse(target='destination_folder')],
[sg.Submit(), sg.Cancel()]]
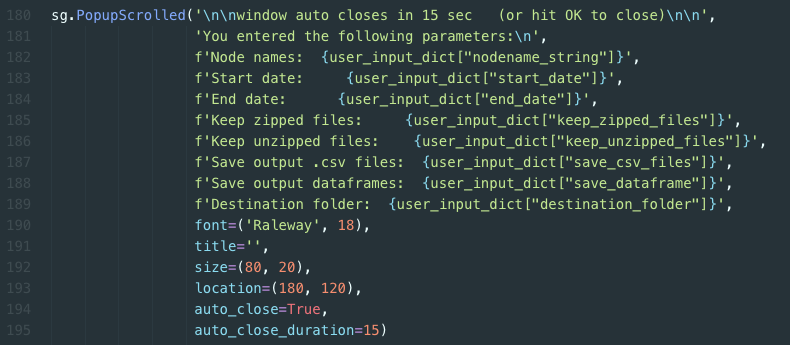
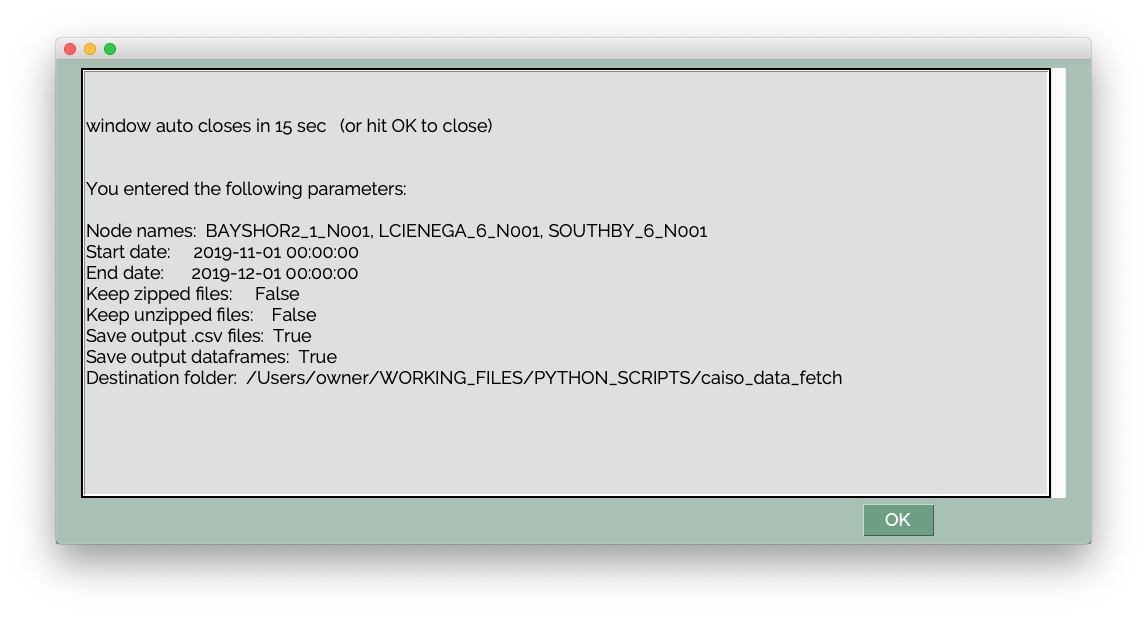
Timed Popup Window for Echoing Back User Inputs
Just so the user understands that the application has accepted the responses, we echo back the contents of the user_inputs_dict to the user. In this instance, I used a timed-scrolled window that closes either when the user clicks “OK”, or after 15 seconds (whichever comes first). Then the script proceeds to the next step.
“Do Stuff” (fetch data) & Progress Bar Update Loop
This is the meat of the fetch utility’s functionality. Please refer to the source code on Github to see what the various defined functions do. This loop takes all of the user-specified input, divides the date-range into appropriate batches, and constructs the correct API command strings for CAISO. The application waits 5 seconds (delay=5) between each call to CAISO (per CAISO’s specifications), and then unzips all the fetched files.
Along the way, a Progress Bar is created, displayed, and updated to keep the user apprised of the program status. Again, PySimpleGui makes this a relatively straightforward process.
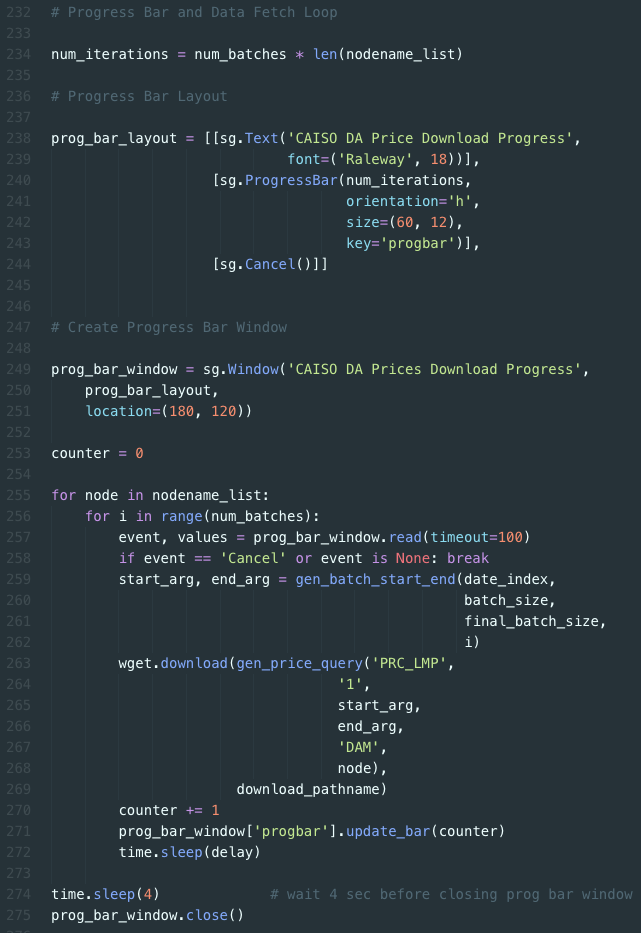
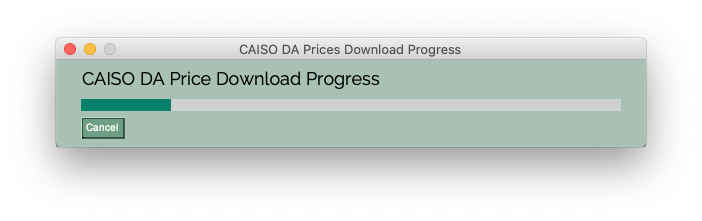
The progress bar remains visible for 4 seconds after this fetch loop is complete, then closes. The program then proceeds to the dataframe consolidation, file saving, and temporary directory deletion tasks.
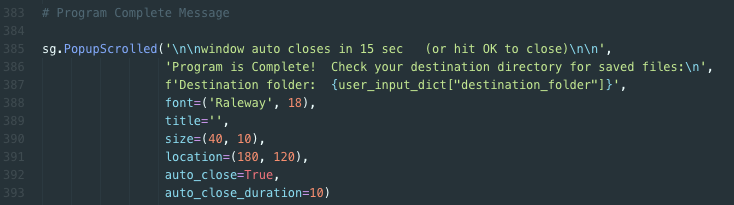
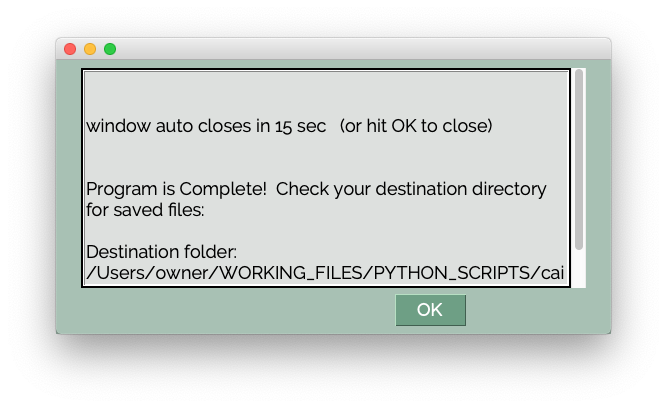
Program Complete Timed Popup Window
Since this might be a long runtime (sometimes over an hour), it is important to signal to the user that the program has successfully completed. However, if the user is not actively observing, I wanted to allow the program to terminate. So this popup window closes after 15 seconds if there is no user response. I used the identical PopupScrolled() method described above.
Ideal Next Step: Freezing
PySimpleGui made the transition from a Jupyter notebook to a standalone Python script fairly straightforward. I find this script to be very useful for my work in the energy and utilities industry. In the future, I’ll be expanding this script to include system operator API’s from other parts of the country: ERCOT in Texas, MISO in the midwest, NYISO in New York, ISONE in New England, and PJM in the mid-Atlantic and up to Chicago.
But even more interesting than geographic expansion would be the possibility of “freezing” this code into an executable app, so that anyone could double-click an icon and run this program. It would free the user from typing a command in a Terminal window, and more importantly, worrying about having installed Python and the proper set of other necessary modules.
Thus far, I’ve tried using PyInstaller, py2exe /py2app, and cx_freeze. None have worked for me so far. I suspect because I’m using ten different imported modules. If I'm unable to "freeze" this script into a cross-platform executable, then I'll be left with the fallback strategy of hosting this script (and the proper Python environment with libraries) in a Docker container. That will likely be the topic of a future article. In the meantime, go fetch!
Resources:
- For the full Python script, go to the GitHub repository here.
- The PySimpleGui user manual & cookbook can be found here.
- The CAISO price map can be found here.
- The CAISO OASIS API website for LMP price downloads can be found at this link.

About The Author
Manu Kalia is a data scientist living and working in San Francisco, CA. A curious, persistent, and articulate data-scientist & entrepreneur skilled in turning chaos into order, and coaxing insights from white noise through data science. Inspired to solve “big” problems that improve life for the many... their health, their wallets, and their environment, using domain expertise in Energy, Renewables, and SmartGrid Management.